Updated: 5/25/2023
“Limited capacity and volatile rates” was the main headline for much of 2020 where the air freight market was concerned. As airlines canceled passenger flights and orders for PPE and essential supplies spiked, the cost to send goods via air freight hit new highs—and held firm for quite some time.
At the start of 2023, we’re seeing a different picture emerge. Capacity is recovering. An analysis from CLIVE Data Services revealed that, in February 2023, air cargo capacity finally rose above pre-pandemic levels. Volume in February 2023 was still below pre-pandemic levels, though—7% less in chargeable weight, as compared to 2019. And rates have fallen significantly YOY, although they still remain elevated above pre-pandemic (2019) levels.
As we consider all of these fluctuations in the air freight market, the question remains:
Where is the industry heading?
To help answer this question, we compiled the following air freight statistics. As you consider your mix of freight, these numbers can offer you some insights as you optimize your supply chain.
Air Cargo Industry Growth
The cargo business remains a major driver for airlines. According to the International Air Transport Association (IATA), air cargo made up more than 35% of airline operating revenue in 2020. In 2022, that number fell a little, with estimates putting air cargo at about 28% of total airline revenue.
Contrast that with 12%, which is how much cargo contributed to airline revenue in 2019.
As you can see, even as air connectivity continues to rebound, air cargo continues to maintain its strong role as a significant revenue stream for airlines.
Starting in March 2022, the air cargo industry began to see a year-over-year decline in chargeable weight. That trend has continued in 2023, although the rate of decline seems to have slowed.
Data from IATA reported an industry-wide YOY decline in cargo tonne-kilometers (CTKs) of 14.9% in January. In February, CTKs declined 7.5% YOY. Despite the continued decline, the lower rate of decline has given some in the industry hope for future growth.
IATA pointed to economic headwinds and global inflation (albeit a slowed rate) for the continued decline.
Whatever the reasons, the trend may offer purchasers some relief. Let’s talk about that next.
YOY rates for air cargo started to decline in September 2022. January and February 2023 continued that trend, with rates below 2022 levels.
However, air freight rates still remain elevated above 2019 levels. CLIVE Data Services/Xeneta reported that February 2023 air freight rates were 35% lower than in February 2022 but still 52% higher than in February 2019.
In other words, even though 2022 saw a decline in air cargo rates, they still remain higher than pre-pandemic ones. As 2023 continues, many will be watching to see which way the global air cargo market trends.
Only one international region has seen CTK growth in the first two months of 2023—Latin America. In January 2023, the region experienced 4.2% YOY growth in CTKs.
However, by February 2023, that region joined all the others in YOY decline in CTKs, the sharpest of which was seen in Europe (16.0% YOY decline in CTKs in February 2023).
Overall YOY decline in February 2023 was less significant than in January, suggesting the possibility of a rebound.
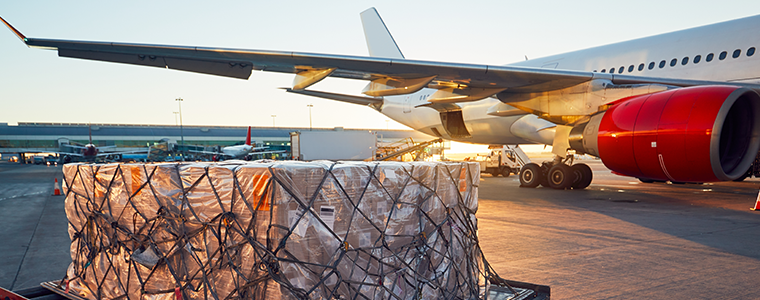
Air Freight Capacity
Although few aspects of the 2023 air cargo market match the 2019 pre-pandemic one, capacity is the exception.
An analysis from CLIVE Data Services puts air cargo capacity in February 2023 at just above capacity in February 2019, which represents an 11% YOY increase.
IATA posted slightly more conservative numbers, estimating an 8.6% YOY increase from February 2022 to February 2023. Either way, it’s good news for shippers looking for space on future flights.
On the international side, belly capacity grew YOY in February by 57%. A number of airlines resumed international routes that were put on pause during the pandemic, leading to the increase in international belly capacity.
Still, there’s room to grow to reach 2019 levels of international belly capacity. February 2023’s international belly capacity numbers represent just 75.1% of what was available in February 2019.
Although capacity is still lagging in some international regions when comparing 2019 to 2023, there are a few areas of growth according to travel data provider OAG.
In March 2023, Central/Western Africa saw a 9.8% increase in capacity when comparing 2019 to 2023. Central Asia was right behind, with a 7.2% positive increase from 2019 to 2023.
OAG credits some of this capacity growth in Central Asia to the war in Ukraine, which has motivated a great deal of travel in the region as people move away from the conflict. Other factors contributing to the rise in capacity in Central Asia include increased trade and tourism in the region. Regions seeing particular growth include Tajikistan, which saw a 96.9% increase in capacity between Summer 2019 and Summer 2023.
Air Freight vs. Other Modes
Finally, if you’re considering other modes of transportation, like ocean freight, we’ve got one key statistic to consider.
Ocean freight reliability hit some serious lows in January 2022. According to data from Statista, the average monthly schedule reliability of main container carriers hit 30.4% at the start of last year. By January 2023, that number had rebounded to 52.6%, an improvement. However, reliability numbers haven’t recovered to 2020 levels, when the industry was looking at numbers like 68.5% (January 2020) and 77.7% (June 2020).
In other words, while ocean freight might still have a cost advantage, air freight remains a superior mode in terms of reliability and scheduling.
What Does It All Add Up To?
In summary, even as capacity continues to recover and rates decline below 2022 levels, the future direction of the air cargo market remains in flux. IATA’s February 2023 Air Cargo Market Analysis points out a link between the global trade environment and air cargo demand. In other words, keeping an eye on the global economic environment could also offer insights on future air cargo trends.
Ultimately, a good relationship with an experienced forwarder remains one of the best ways to deal with fluctuations in price and demand where air cargo is concerned. The experts who work with air freight every day can offer you personalized advice, based on your business—and what they’re seeing in the marketplace. They can also help you adjust your freight mix to meet your business goals and your budget.
If you need some assistance with your air freight shipments—or your freight mix—just reach out to one of our experts. We’re happy to help!
One More Air Freight Statistic, Just for Fun
We’ll close out this data discussion with a quick pop quiz:
80% of all air cargo traffic between Asia and North America passes through what U.S. airport?
The answer? It’s not HNL or any other West Coast airports including LAX or Sea-Tac.
It’s Ted Stevens Anchorage International Airport! Because of a little tweak to the Jones Act, international planes are allowed to stop in Anchorage and refuel before heading to an American airport. As a result, approximately 80% of all air cargo traffic between Asia and North America passes through Anchorage. Now you know!
Want to talk more about air cargo for your business? Interested in adjusting your freight mix? One of our experts would be happy to help! Just get in touch with us for a free consultation. We’d be happy to take a look at your current operations and suggest a plan to optimize your supply chain for today’s markets.
Get a Free Quote


